Ten tokens held 62% of altcoin futures exposure, but shared collateral can put other positions at risk
A recent Talos market report reveals that ten tokens account for 62% of altcoin futures exposure, highlighting concentrated open interest and shifting funding costs across major exchanges like Binance.

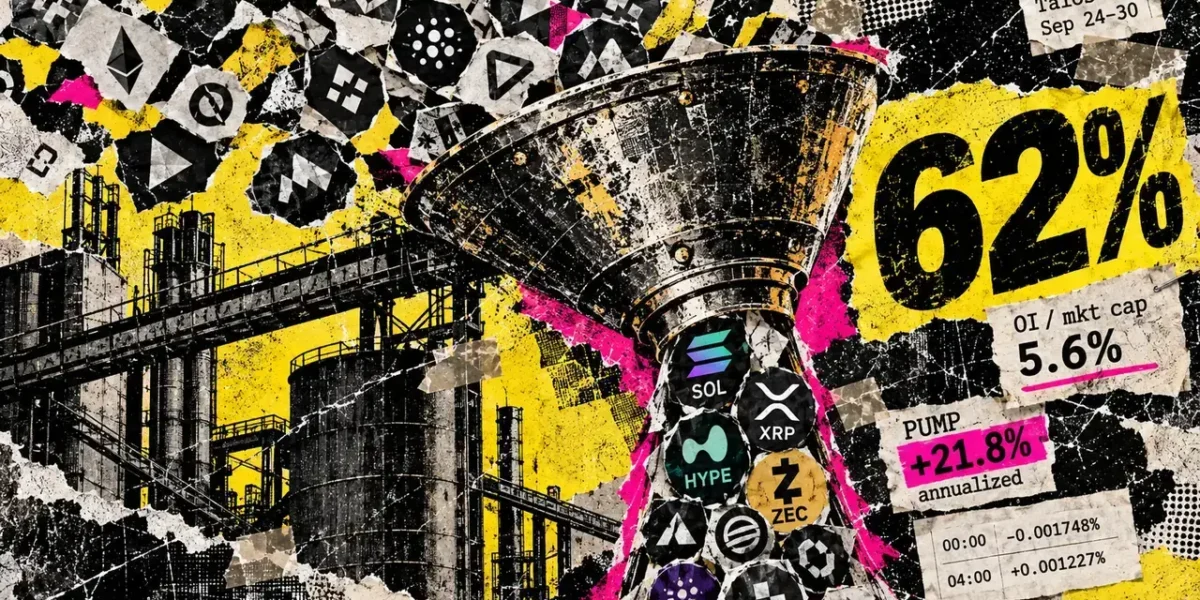
As detailed in Talos’s weekly market report for September 24–30, 2026, ten specific tokens made up 62% of all outstanding altcoin futures exposure, commonly referred to as open interest. This heavily concentrated exposure came with varying financing costs: the publication noted that SOL funding dropped below zero, while the annualized funding rate for PUMP hit +21.8%.
Released on October 1, the report additionally recorded altcoin open interest at 5.6% relative to total market capitalization, marking a record high within Talos’s historical series. For market participants navigating the October trading week, these figures highlight a dense derivatives footprint, while subsequent Binance settlements demonstrate how rapidly the expense of maintaining a specific contract can shift.
Funding pressure can change within hours
Perpetual futures rely on funding payments to keep contract pricing closely aligned with the underlying market. As outlined by Hyperliquid’s funding mechanics, positive rates mean long holders pay short holders, while negative rates do the reverse. Consequently, a trader’s financing expenses vary based on the specific contract, trading side, and funding interval—even when two different tokens share substantial open interest.
The October 5 update examines two distinct Binance contracts rather than providing an exact counterpart to Talos’s broader altcoin aggregate. Their settled payment histories, pulled shortly after 04:20 UTC, revealed a positive SOL funding rate alongside a PUMP rate that flipped signs within a four-hour window.
| Binance contract | Settlement, Oct. 5, 2026 (UTC) | Native settled funding rate | Paying side |
|---|---|---|---|
| SOLUSDT | 00:00 | +0.010000% | Longs pay shorts |
| PUMPUSDT | 00:00 | -0.001748% | Shorts pay longs |
| PUMPUSDT | 04:00 | +0.001227% | Longs pay shorts |
The prior recorded payment for SOL, captured at 16:00 UTC on October 4, also sat at +0.010000%, exactly eight hours ahead of the midnight settlement. Meanwhile, PUMP’s two tracked payments occurred just four hours apart.
The midnight payment for PUMP charged short positions, whereas its 04:00 payment charged long positions. This shift demonstrates how financing costs can reverse course while the underlying contract remains unchanged. Furthermore, SOL’s positive midnight payment contrasts with the negative funding highlighted in the earlier Talos data snapshot.
Annualization translates periodic rates into a standardized baseline for comparison rather than locking in a full year of expenses. Documentation from Coin Metrics differentiates the active period of a rate from the input timeframe utilized for its calculation. For instance, Hyperliquid handles hourly settlements by splitting an eight-hour formula into hourly chunks.
Coin Metrics’ aggregation methodology weights normalized market rates by dollar open interest and scales longer aggregate periods in a linear fashion. Its daily figures function as boundary samples rather than true daily averages. While these definitions explain accessible metrics, they do not pinpoint the exact underlying series or averaging window behind Talos’s reported +21.8% figure for PUMP.
What the concentration figures measure
Talos listed SOL, XRP, HYPE, and ZEC among the largest markets within its top-ten cohort. The 62% metric highlights where trading exposure was concentrated inside its monitored altcoin category. To determine if these specific tokens held unusually large derivatives positions relative to their scale, one would need to compare their exposure share directly against their proportion of total market value using identical assets and timestamps.
The report’s text leaves out the exact historical start date and the specific treatment of ETH. These omissions mean the data remains strictly tied to Talos’s proprietary series, preventing anyone from stretching the 62% concentration metric into a broader claim of excessive market crowding.
The 5.6% ratio addresses a completely separate metric: the scale of outstanding exposure compared to the overall value of the tokens covered. Coin Metrics’ capitalization standards differentiate between the value of currently issued supply, estimated circulating supply, and free-float supply. These different parameters can assign entirely separate valuations to the exact same token, particularly when significant supply remains locked in escrow or held by strategic entities. Because the report does not clarify which standard serves as its denominator, the 5.6% figure ought to be viewed strictly as a Talos-specific ratio rather than an absolute, universal measure of altcoin leverage.
Under conventional definitions of open interest, every open contract involves both a buyer and a seller, with only one side counted. Thus, open interest reflects unresolved contractual exposure.
Dollar valuations introduce yet another layer of distinction. Market-data feeds from Binance separate open contract quantities from their total dollar value. A higher dollar figure may stem from shifting asset prices, changing quantities, or a combination of both. For a single linear contract featuring a matched price basis alongside static quantities and unchanged supply metrics, a price shift can cancel out within the ratio. However, across a diverse basket, relative prices and individual constituents continue to play a major role.
The newly updated exposure observations carry a similar level of specificity. Binance recorded approximately $1.045 billion in SOLUSDT open interest value at 04:20 UTC on October 5, while its PUMPUSDT figure sat at roughly $142.876 million at 04:15 UTC.
Concentrated positions can share collateral
Talos interpreted its exposure concentration as a factor that limits risk to a relatively small group of tokens. Its sector analysis from September 29 also characterized the underlying market rally as higher in quality.
Margin rules on platforms like Hyperliquid demonstrate why this distinction is vital. Cross-margin accounts pool collateral across all eligible positions, whereas isolated margin restricts collateral to a single, standalone position. When collateral is shared, losses sustained in one holding can directly threaten the financial resources supporting another. The extent of this risk sharing depends entirely on the chosen account mode and the specific markets involved.
Liquidation protocols initiate automatic actions whenever account equity drops below established maintenance thresholds. The exchange initially attempts to unwind positions through the order book, with backstop mechanisms available under predefined circumstances. Funding payments and financial losses across other cross-margin positions can heavily influence an account’s real-time liquidation thresholds.
An exposure share statistic cannot reveal individual account balances, the distance to liquidation, or available order book depth. Consequently, it cannot prove that a liquidation cascade is inevitable, nor can it guarantee that risk remains successfully contained solely within the tokens possessing the highest open interest.
Earlier reporting by CryptoSlate regarding ETF concentration and altcoin spot turnover explored other angles of the broader market rotation. Fund flows track asset allocations, turnover measures active trading volume, open interest captures unresolved contracts, and funding rates define ongoing financing costs.
For investors evaluating the current environment, the most valuable upcoming data points include a direct comparison of exposure versus token value, a sequential history of settled funding payments, and a clear view of the collateral and liquidity conditions underpinning these positions. The reported 62% concentration metric establishes a useful starting point for that evaluation, while the October 5 settlement figures illustrate how fast financing costs can pivot from that baseline.
Frequently Asked Questions
01What is open interest in crypto futures?
Open interest represents the total number of outstanding derivative contracts, such as futures or options, that have not been settled or closed out. Every open contract consists of a buyer and a seller, helping traders gauge market liquidity and capital flow.
02How do perpetual futures funding rates work?
Funding payments are periodic exchanges between long and short positions designed to anchor the perpetual contract price to the spot price of the underlying asset. Positive rates mean longs pay shorts, while negative rates mean shorts pay longs.
03What is the difference between cross margin and isolated margin?
Cross margin pools an account’s entire collateral balance to support all open positions, increasing the risk that a loss in one trade can impact others. Isolated margin restricts collateral to a single position, limiting potential losses to the funds specifically allocated to that trade.