
2026 में छह अमेरिकी बैंक विफल हो चुके हैं लेकिन आंकड़े 2023 जैसे बिल्कुल नहीं दिखते
यद्यपि 2026 में छह अमेरिकी बैंक विफल हो गए हैं, जो 2023 के कुल आंकड़े को पार कर गया है, डेटा से पता चलता है कि इन हालिया विफलताओं का पैमाना काफी छोटा है, जिसमें सिलिकॉन वैली बैंक के पतन का प्रणालीगत परिमाण नहीं है।

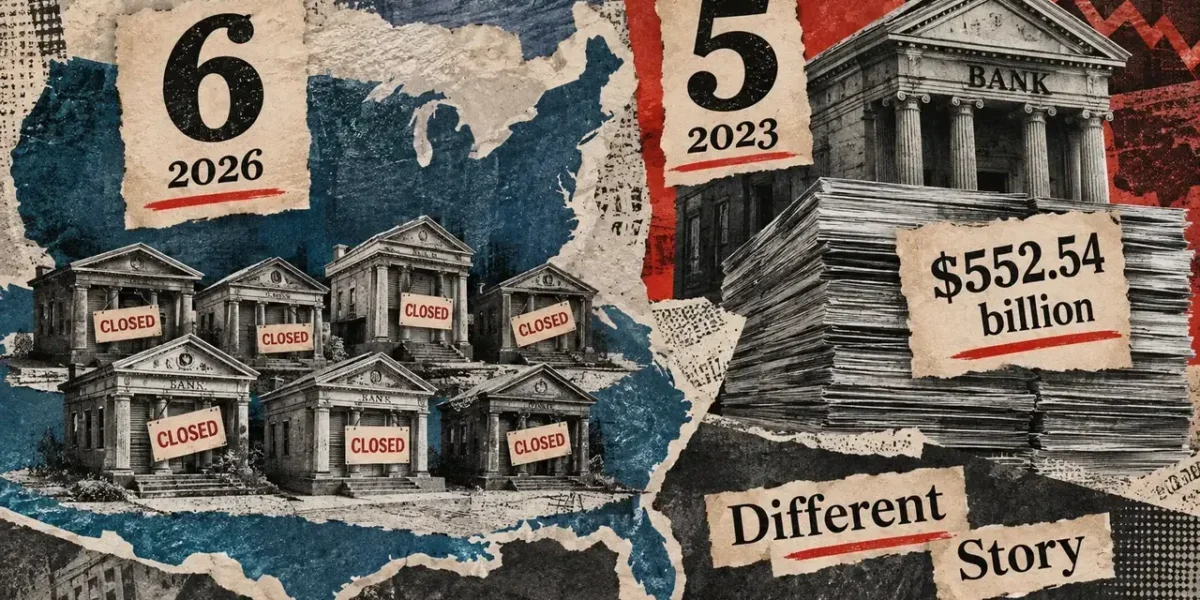
So far in 2026, six US banking institutions have collapsed. This is one more than the total for all of 2023, a figure that easily triggers fears of a renewed banking crisis.
However, before drawing parallels to Silicon Valley Bank, it is important to examine the scale of these six lenders. According to historical data from the Federal Deposit Insurance Corporation (FDIC), they held a combined total of roughly $1.43 billion in assets. By contrast, the banks that failed in 2023 accounted for approximately $552.54 billion.
Treating every bank failure as a single unit provides an accurate count but a misleading picture of systemic magnitude. This year’s tally includes a smaller institution with just $3.73 million in assets, weighting it equally in the headline count with a giant like SVB.
At the same time, the FDIC’s most recent industry performance evaluation indicates higher profits and a shrinking problem list. While these six closures were significant and not every surviving lender is thriving, claims of a 2023 repeat lack adequate backing.
The closure of Nano Banc on Sept. 25 brought the yearly total to six and marked the largest failure of 2026 to date. The Irvine, California-based institution held $736 million in assets, and the FDIC projected a $114 million impact on its Deposit Insurance Fund.
While someone must absorb that financial loss, trouble at one specific lender does not imply broader contagion across the banking sector.
Six is bigger than five (until you look inside)
Historical FDIC figures record four failures in 2020, zero in 2021 and 2022, five in 2023, and two in both 2024 and 2025. With six failures recorded by Sept. 25, the current year surpasses any annual total from the 2020s, though the headline is far more alarming than the underlying reality.
Consider Kentland Federal Savings and Loan Association, which was identified by the FDIC as the smallest independent bank in the nation when it shut down. Its $3.73 million in assets carries the exact same weight on a chart of bank failures as Silicon Valley Bank, because such charts measure only the number of institutions rather than their financial footprint.
Relying on this metric to gauge financial risk gives a micro-lender an outsized presence in the data.
| Failed institution | Closure date in 2026 | Reported assets |
|---|---|---|
| Metropolitan Capital Bank & Trust | Jan. 30 | $261.10 million |
| Community Bank and Trust – West Georgia | May 1 | $288 million |
| Kentland Federal Savings and Loan Association | July 10 | $3.73 million |
| Small Business Bank | July 17 | $73 million |
| Tioga-Franklin Savings Bank | Aug. 21 | $68 million |
| Nano Banc | 25 सितर्ब | $736 million |
| Combined | Through Sept. 25 | $1.43 billion |
Because the $552.54 billion figure for 2023 and the $1.43 billion total for 2026 originate from balance sheets with different reporting periods, a direct mathematical ratio cannot be established. Even without an exact ratio, it is clear these amounts belong to entirely different categories of economic scale, regardless of whether six technically exceeds five.
The FDIC’s problem-bank list introduces another dynamic, tracking active institutions based on their condition at a specific point in time. Banks are added when examiners issue one of the two lowest composite ratings due to financial, operational, or managerial deficiencies—a much more precise diagnosis than a difficult week in the equities market.
The second-quarter assessment recorded 47 lenders on that list as of June 30, down from 54 in March and 60 at the conclusion of 2025. These institutions accounted for roughly 1.1% of all insured banks, staying within the FDIC’s typical baseline range of 1% to 2% during non-crisis periods.
This does not imply the sector is entirely without risk, as banks can exit the problem list via failure, recovery, or merger. Because failure tallies accumulate over the course of the year while the problem list offers a snapshot of currently open institutions, a longer failure count and a shorter problem list are not contradictory.
Temporal differences also complicate direct calculations. Four of the six recent failures took place between July and September, following the June snapshot, but deducting four from 47 does not reliably calculate the remaining troubled institutions.
The exact movements of banks entering or exiting the list during the intervening months are not fully detailed in published metrics.
Some banks were broken long before the headline
The public records surrounding these closures point to institutions that had faced operational challenges for extended periods. Illinois regulators noted that Metropolitan Capital suffered from impaired capital and unsafe practices, while Kansas authorities highlighted prolonged financial difficulties at Small Business Bank.
At the Kansas institution, persistent operating losses eroded its capital buffer until it was classified as critically undercapitalized. Capital acts as a protective shield against losses before creditors are impacted, and continuous losses can exhaust that reserve even while the broader financial industry enjoys a profitable quarter.
External profitability does not replenish an individual bank’s capital. Kentland encountered a similar fate; the Office of the Comptroller of the Currency determined that unsafe practices had depleted its assets and earnings with no viable path to restoring adequate capital levels.
Tioga-Franklin operated under a prior FDIC consent order addressing deficiencies in management, capital planning, liquidity, and credit administration. While the institution consented without admitting or denying the findings, the regulatory record indicates supervisors had flagged concerns well before its August closure.
Less public detail is available regarding the specific diagnosis for Community Bank and Trust – West Georgia. State closure notices granted the authority to assume control without publishing an exhaustive financial breakdown, and the FDIC inspector general is currently conducting a material loss review.
Attributing the exact same root causes to this closure as the others would oversimplify the available evidence.
Nano also carried an extensive regulatory background. California Business and Consumer Services Secretary Rohit Chopra highlighted repeated infractions and prior enforcement actions related to managerial issues, alongside elevated levels of uninsured deposits.
Depositors holding funds above the statutory insurance limit face greater exposure if a bank fails, providing a distinct incentive to withdraw funds if confidence wavers.
Recognizing these challenges does not require viewing the six banks as a cascade of falling dominoes. Official records document isolated vulnerabilities within specific lenders rather than a widespread funding shock or a chain reaction of failures.
Grouping these institutions into a single table does not establish an underlying financial linkage between them.
Broader economic data also challenge the narrative of widespread community bank distress. According to FDIC second-quarter reports, community lenders posted an 8.2% increase in earnings compared to the prior quarter, while industry-wide profits reached $90.1 billion.
The regulator characterized overall capital and liquidity buffers as robust, leaving ample financial cushion despite isolated failures within a profitable sector.
The losses are real even when the apocalypse isn’t
A bank failure remains a serious event for the individuals directly affected.
The estimated $114 million cost to the insurance fund resulting from Nano’s collapse is a tangible financial outcome, though Sunwest Bank agreed to assume the vast majority of its deposits and acquire approximately $476 million of its assets.
The FDIC retained the remaining assets for liquidation, noting that customers retained access to checks and payment cards throughout the transition weekend.
Account holders could continue managing expenses while the receivership managed liabilities, highlighting that immediate deposit availability and the ultimate resolution cost are distinct metrics.
FDIC cost estimates fluctuate as retained assets are liquidated, and the $1.43 billion in combined assets across the six failed banks should not be viewed as total capital vaporization. Loans remain collectible and securities can be monetized even after an institution fails.
Tioga-Franklin’s acquirer assumed all deposits, whereas the West Georgia transaction transferred substantially all *insured* deposits while excluding certain brokered accounts.
Georgia authorities stated that depositors with balances exceeding insurance limits would receive formal notices outlining their rights as uninsured creditors—an experience quite different from simply seeing a new institution’s name on an active account statement.
Coverage by *CryptoSlate* regarding the year’s initial bank failure touched upon wider banking vulnerabilities, though the causal link between a closed lender and digital assets requires careful analysis. Observers must evaluate whose capital was held at the institution and what transactional capabilities were halted upon closure.
In 2023, Circle maintained $3.3 billion of its USDC reserves within Silicon Valley Bank, creating direct exposure for stablecoin holders regarding the backing of their digital tokens. Federal Reserve evaluations of that event explicitly mapped the transmission of bank stress into the stablecoin market.
The current year’s statistics do not automatically establish an equivalent connection. Concrete proof—such as disclosed digital asset reserves at a failed lender or disruptions to essential payment processing infrastructure—is required to substantiate such claims.
Simply adding another entry to the failure tally does not reveal whose reserves are locked or which businesses have lost liquidity access.
Ongoing monitoring of the banking sector remains prudent, particularly regarding withdrawal trends across institutions and potential funding pressures. The volume of assets tied to the problem-bank list also warrants close observation, as a shrinking list can still harbor substantial financial risk.
None of those complex risk assessments can be resolved by simply comparing six failures to five.
Arguments forecasting a return to 2023 conditions must demonstrate how instability is actively transmitting through surviving institutions. Until concrete evidence supports that claim, six isolated bank closures indicate only that those specific entities could not sustain operations, and converting a head count into a system-wide verdict misinterprets the data.
अक्सर पूछे जाने वाले प्रश्न
01Why did six bank failures in 2026 not cause a major financial crisis like in 2023?
While the number of bank failures in 2026 is slightly higher than in 2023, the overall asset scale is vastly different. The six banks that failed in 2026 held a combined total of roughly $1.43 billion in assets, compared to approximately $552.54 billion held by the banks that collapsed in 2023.
02What does the FDIC problem-bank list show about the US banking system?
The FDIC’s problem-bank list tracks active institutions facing financial, operational, or managerial weaknesses. As of the second-quarter assessment, 47 banks were on the list—representing about 1.1% of all insured institutions, which falls comfortably within the FDIC’s normal historical range of 1% to 2% outside of a crisis.
03Are insured and uninsured depositors treated the same way when a bank fails?
No. When a bank fails, insured deposits are typically transferred to an acquiring institution or promptly paid out by the FDIC. Depositors with balances exceeding the federal insurance limits may face exposure and must navigate receivership processes to recover uninsured funds.