बिटकॉइन की $87,000 की रैली शॉर्ट स्क्वीज़ से बदलकर लॉन्ग रिस्क बन गई है
बिटकॉइन हाल ही में $87,400 के करीब आठ महीने के उच्चतम स्तर पर पहुंच गया, लेकिन कमजोर होती स्पॉट मांग, घटते ETF इनफ्लो और बढ़ती मुनाफावसूली से संकेत मिलता है कि बाजार को ठंडे दौर और बदलते लिक्विडेशन जोखिमों का सामना करना पड़ रहा है।

बिटकॉइन के नए पुष्ट बुल मार्केट में पहले से ही ऐसे संकेत दिखाई दे रहे हैं कि इसकी हालिया ऊपर की गति ठंडी हो सकती है।
पिछले हफ्ते, क्रिप्टोक्वांट (CryptoQuant) द्वारा एक महत्वपूर्ण दीर्घकालिक तकनीकी स्तर को पार करने के बाद प्रमुख क्रिप्टोकरेंसी $87,400 के पास आठ महीने के शिखर पर पहुंच गई, जिसे एक नए तेजी चक्र की शुरुआत के रूप में पहचाना गया था। तब से, बिटकॉइन बुल स्कोर इंडेक्स 100 में से 90 पर पहुंच गया है, जो व्यापक रूप से सकारात्मक बाजार स्थितियों को दर्शाता है।
इसके अलावा, लुक इन्टू बिटकॉइन (Look Into Bitcoin) के मेट्रिक्स संकेत देते हैं कि “जुलाई 2025 के बाद से बिटकॉइन की भावना अपने सबसे लालची स्तर पर पहुंच गई है।”
हालांकि, इस सतही मजबूती के भीतर, ताजी खरीदारी में रुचि और दीर्घकालिक निवेशकों द्वारा मुनाफा निकालने के बीच का संतुलन बदलने लगा है।
यह बदलाव अभी बड़े ट्रेंड के पतन का संकेत नहीं देता है। बिटकॉइन कई प्रमुख दीर्घकालिक समर्थन चिह्नों से ऊपर बना हुआ है और उसने अपने हालिया लाभ का एक महत्वपूर्ण हिस्सा बनाए रखा है। फिर भी, नरम पड़ती मांग और भारी मुनाफावसूली का संयोजन यह सुझाव देता है कि ब्रेकआउट के बाद बाजार को जल्द ही अपनी पहली बड़ी परीक्षा का सामना करना पड़ सकता है।
स्पॉट खरीदारी कमजोर होने और धारकों द्वारा मुनाफा वसूलने से मांग फीकी पड़ी
सबसे स्पष्ट दबाव उन प्राथमिक मांग चैनलों पर उभर रहा है जिन्होंने शुरू में बिटकॉइन की बढ़त को बढ़ावा दिया था।
क्रिप्टोक्वांट का अनुमान है कि 30 दिन की अवधि में स्पष्ट स्पॉट मांग लगभग 170,000 BTC तक घट गई, जो यह इशारा करती है कि नकद-बाजार की खरीदारी ऊपर की कीमत की गति के साथ तालमेल बिठाने में विफल रही है।
US एक्सचेंज-traded फंड्स में प्रवाह एक समान प्रवृत्ति को दर्शाता है। CryptoSlate ने पहले रिपोर्ट किया था कि एक सप्ताह के दौरान दैनिक ETF इनफ्लो 97% तक गिर गया, जो 28 सितंबर तक लगभग $1 बिलियन से गिरकर सिर्फ $31 मिलियन रह गया।
इस बीच, सट्टेबाजी की रुचि और भी तेजी से ठंडी हुई है।
क्रिप्टोक्वांट की गणना है कि 14 सितंबर के 164,000 BTC की तुलना में फ्यूचर्स की मांग में वृद्धि घटकर लगभग 16,000 BTC रह गई है, जिससे बिटकॉइन के $87,400 के स्तर से पीछे हटने पर वृद्धिशील खरीद दबाव की एक और महत्वपूर्ण परत हट गई है।
इस मंदी का अधिक महत्व है क्योंकि मौजूदा बाजार प्रतिभागी काफी बड़े मुनाफे पर बैठे हैं।
अल्पकालिक व्यापारियों के लिए अप्राप्त (अनरेलाइज्ड) लाभ मार्जिन 33% तक बढ़ गया है, जो दिसंबर 2024 के बाद से सबसे उच्चतम बिंदु है और संभावित लाभ के दायरे को बढ़ाता है यदि निवेशक अपने जोखिम को कम करने का निर्णय लेते हैं।
कुछ बाजार प्रतिभागियों ने पहले ही इस प्रक्रिया को शुरू कर दिया है।
क्रिप्टोक्वांट के अनुसार, बिटकॉइन धारकों ने 22 सितंबर को 25,700 BTC पर मुनाफा बुक किया—जो 2026 में दर्ज किए गए सबसे बड़े एकल-दिन के कुल को दर्शाता है—क्योंकि व्यापारियों ने हालिया ट्रेडिंग रेंज की ऊपरी सीमा के पास रैली का लाभ उठाया।
परिणामस्वरूप, बिटकॉइन को एक बढ़ती विसंगति का सामना करना पड़ रहा है: नई खरीद की गति कम हो गई है जबकि बिक्री के लिए उपलब्ध लाभदायक सिक्कों की मात्रा बढ़ गई है।
हालांकि यह गतिशीलता एक निश्चित चक्र के शिखर का संकेत नहीं देती है, लेकिन ऊपर की ओर एक और निरंतर धक्का के लिए संभवतः स्पॉट खरीदारी में इतनी मजबूत तेजी की आवश्यकता होगी जो कम कीमत के बिंदुओं पर मूल रूप से बिटकॉइन प्राप्त करने वाले निवेशकों से मुनाफावसूली को अवशोषित कर सके।
फ्यूचर्स ने संभाला मोर्चा, बिटकॉइन लॉन्ग्स पर लिक्विडेशन का जोखिम
कुल उत्तोलन (लेवरेज) के स्तर कम होने के बावजूद, बिटकॉइन का अंतर्निहित बाजार ढांचा डेरिवेटिव पर अत्यधिक निर्भर हो गया है।
क्रिप्टोक्वांट का डेटा बिनेंस पर स्पॉट-टू-फ्यूचर्स वॉल्यूम अनुपात को 0.12 के करीब रखता है, जिसका तात्पर्य है कि कुल ट्रेडिंग वॉल्यूम का लगभग 90% फ्यूचर्स सेक्टर के भीतर होता है। स्पॉट मार्केट में लेनदेन किए गए प्रत्येक एक डॉलर के लिए, लगभग $8 से $9 डेरिवेटिव उपकरणों के माध्यम से हाथ बदलते हैं।
समग्र लेवरेज में संकुचन के बावजूद, लगातार सुस्त खुदरा और नकद-बाजार की भागीदारी के कारण यह असंतुलन शायद ही बदला है।
पिछले एक हफ्ते में बिनेंस ओपन इंटरेस्ट घटकर लगभग $10.6 बिलियन से लगभग $9.2 बिलियन रह गया है। साथ ही, ग्लासनोड (Glassnode) के मेट्रिक्स एक व्यापक downward प्रवृत्ति का खुलासा करते हैं, जो यह दर्शाता है कि हालिया कीमत वृद्धि के बावजूद, BTC के लिए सिक्का-मूल्यवर्ग का ओपन इंटरेस्ट मार्च के बाद से अपने सबसे निचले स्तर पर पहुंचने के लिए लगभग 20% गिर गया है।
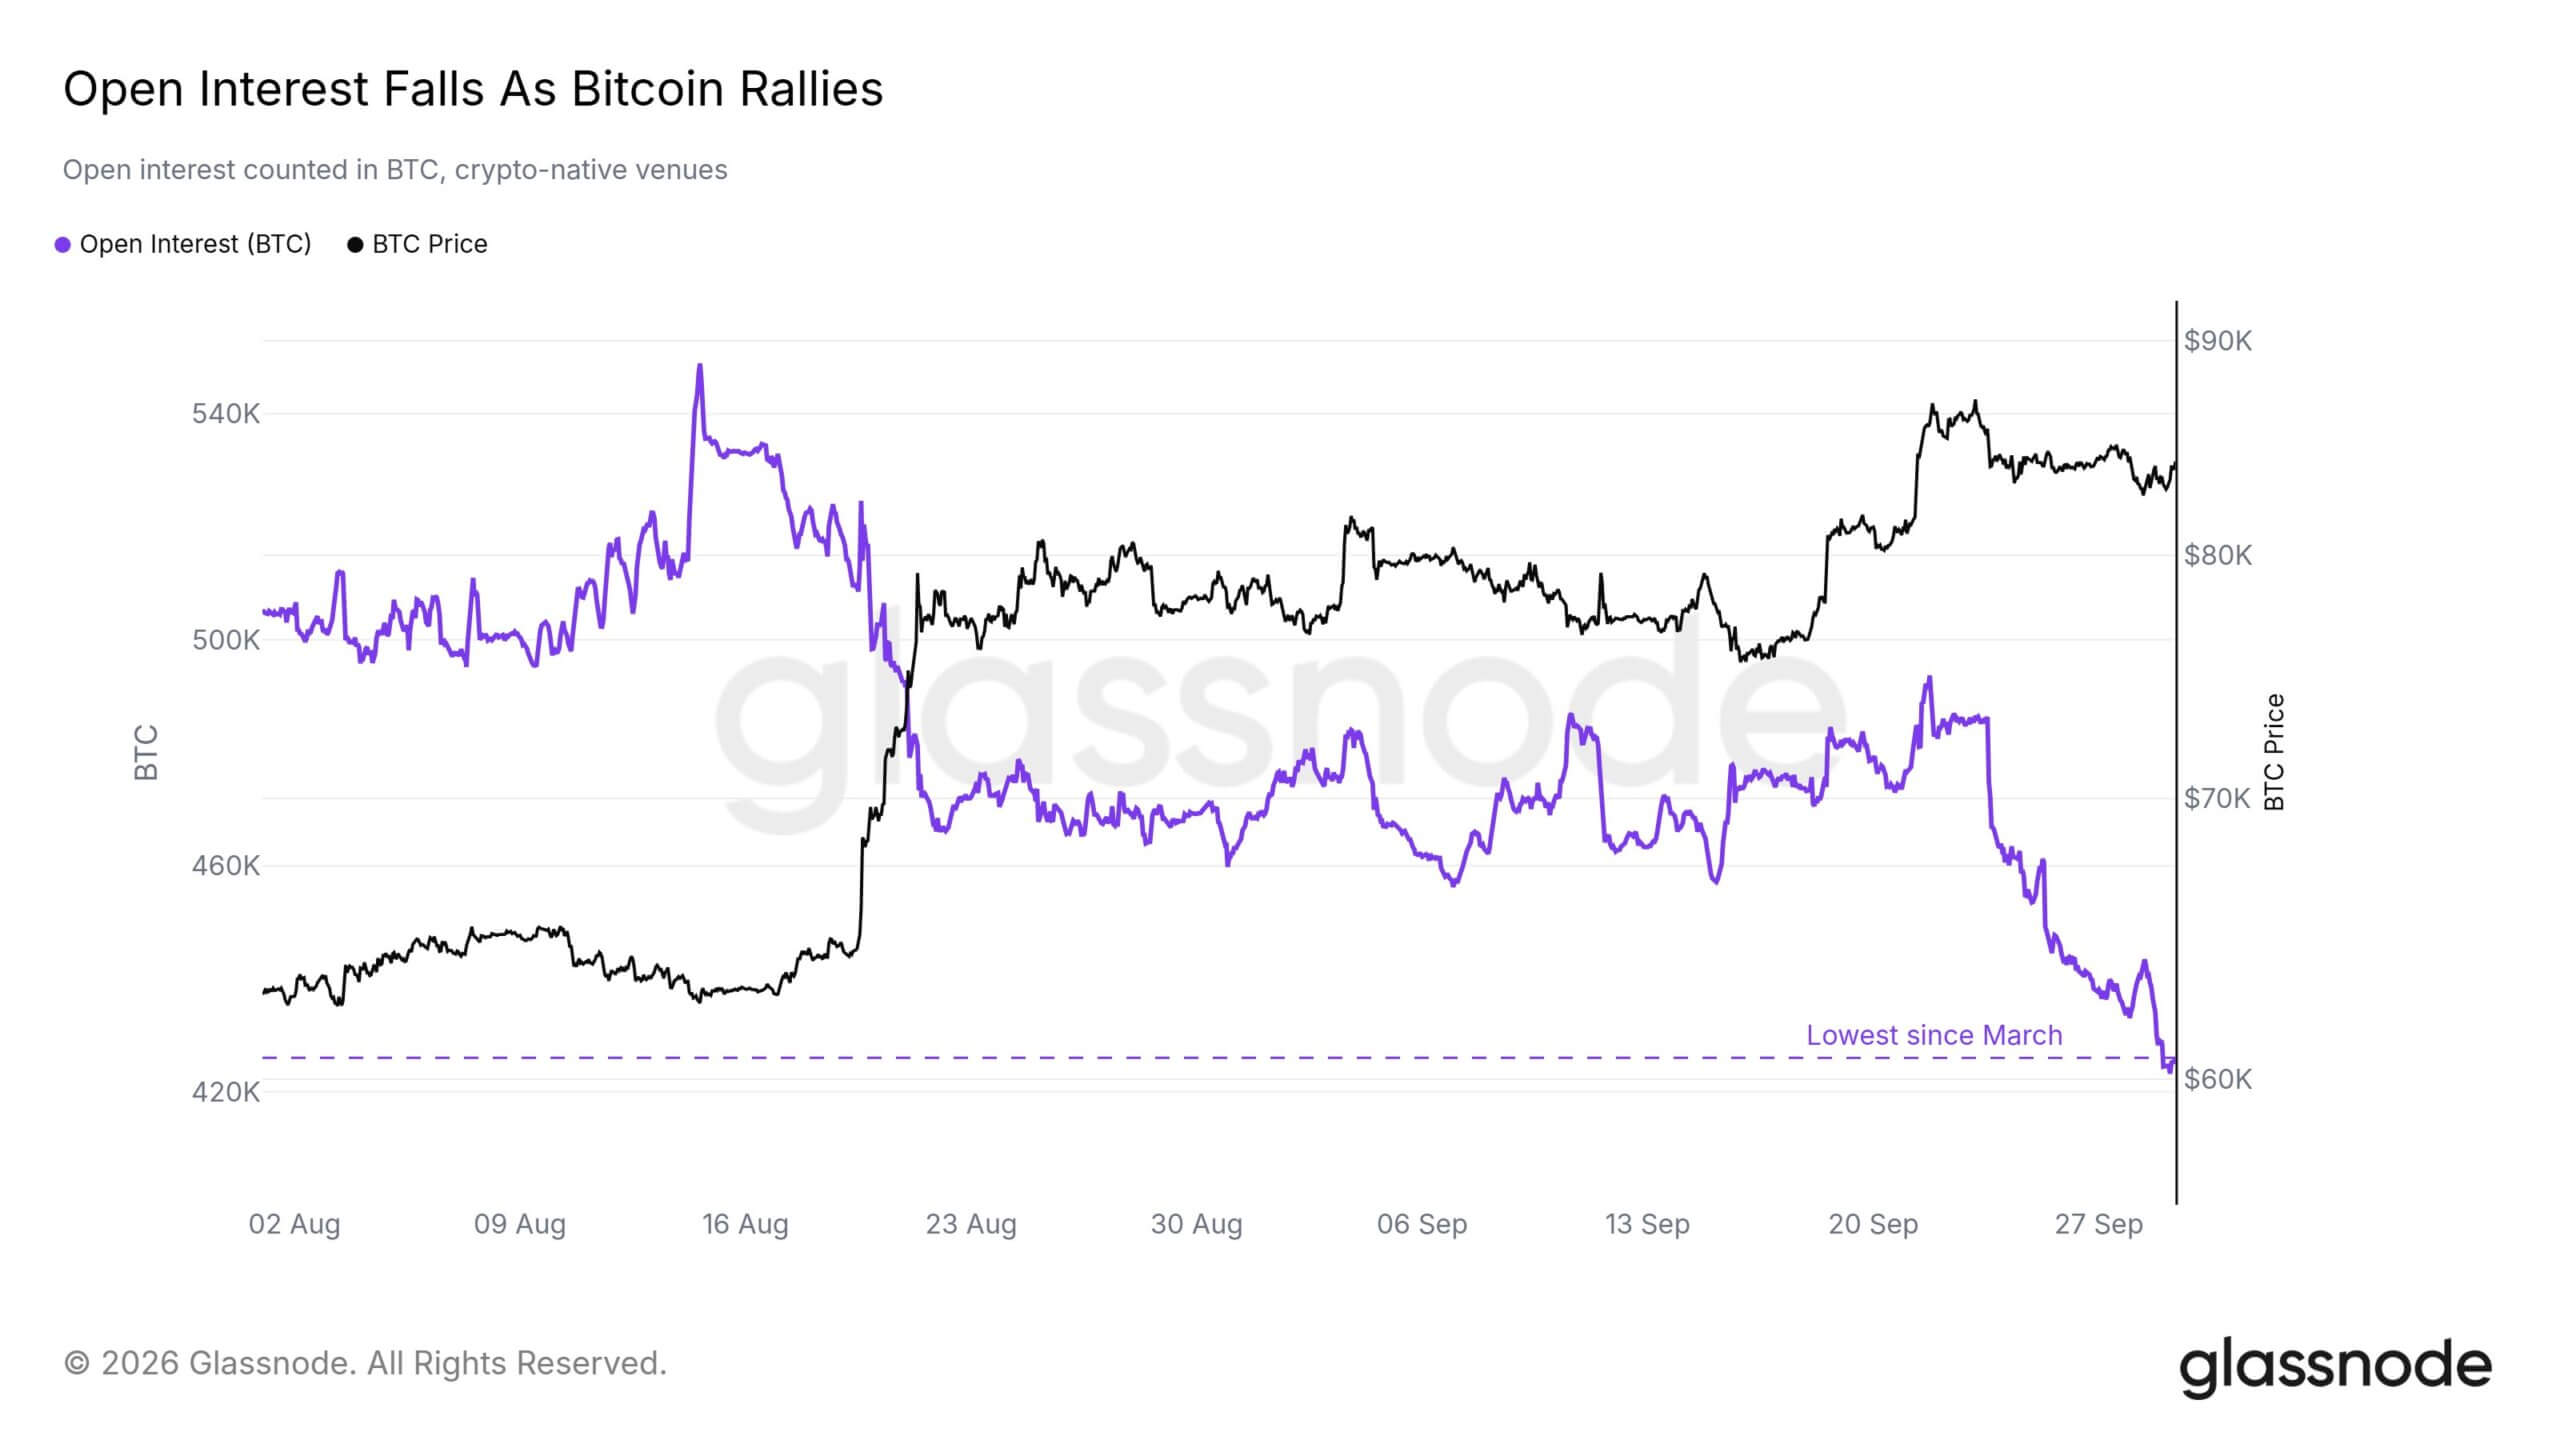
यह कमी दोनों तरह से काम करती है। कम लेवरेज एक और आक्रामक रैली के लिए आवश्यक सट्टा ईंधन को रोकता है, लेकिन साथ ही यह बाजार को भारी रूप से भीड़भाड़ वाले पोजीशनिंग से बचाता है जो अक्सर कैस्केडिंग लिक्विडेशन को ट्रिगर करता है।
फिर भी, शेष लेवरेज की संरचनात्मक बनावट तेजी से महत्वपूर्ण होती जा रही है।
अल्फ्रेक्टल (Alphractal) के आंकड़े प्रदर्शित करते हैं कि $87,000 की ओर बिटकॉइन की चढ़ाई ने पिछले 365 दिनों में निर्मित शॉर्ट पोजीशन के सबसे बड़े सांद्रता को पार कर लिया। ऊपर की ओर उछाल ने उस चीज़ को घेर लिया जिसे विश्लेषणात्मक फर्म ने वर्ष के सबसे बड़े शॉर्ट-लिक्विडेशन पूल के रूप में वर्गीकृत किया, जिससे कीमतों के ऊपर की ओर बढ़ने पर मंदी वाले सट्टेबाजों को बाहर निकलने के लिए मजबूर होना पड़ा।
उन लिक्विडेशन ने एक उत्प्रेरक के रूप में काम किया, जिससे शॉर्ट विक्रेताओं को अपनी उधार ली गई संपत्तियों को वापस खरीदने के लिए मजबूर होने पर रैली को बल मिला।
हालांकि, जबरन खरीदारी का वह विशिष्ट भंडार अब काफी हद तक समाप्त हो गया है।
अल्फ्रेक्टल ने उल्लेख किया कि सबसे बड़े अनिष्पादित (अनलिक्विडेटेड) पोजीशन क्लस्टर वर्तमान में लॉन्ग पोजीशन की ओर भारी झुकाव रखते हैं, जिससे हालिया शॉर्ट स्क्वीज़ के बाद बाजार की लिक्विडेशन कमजोरी उलट गई है।
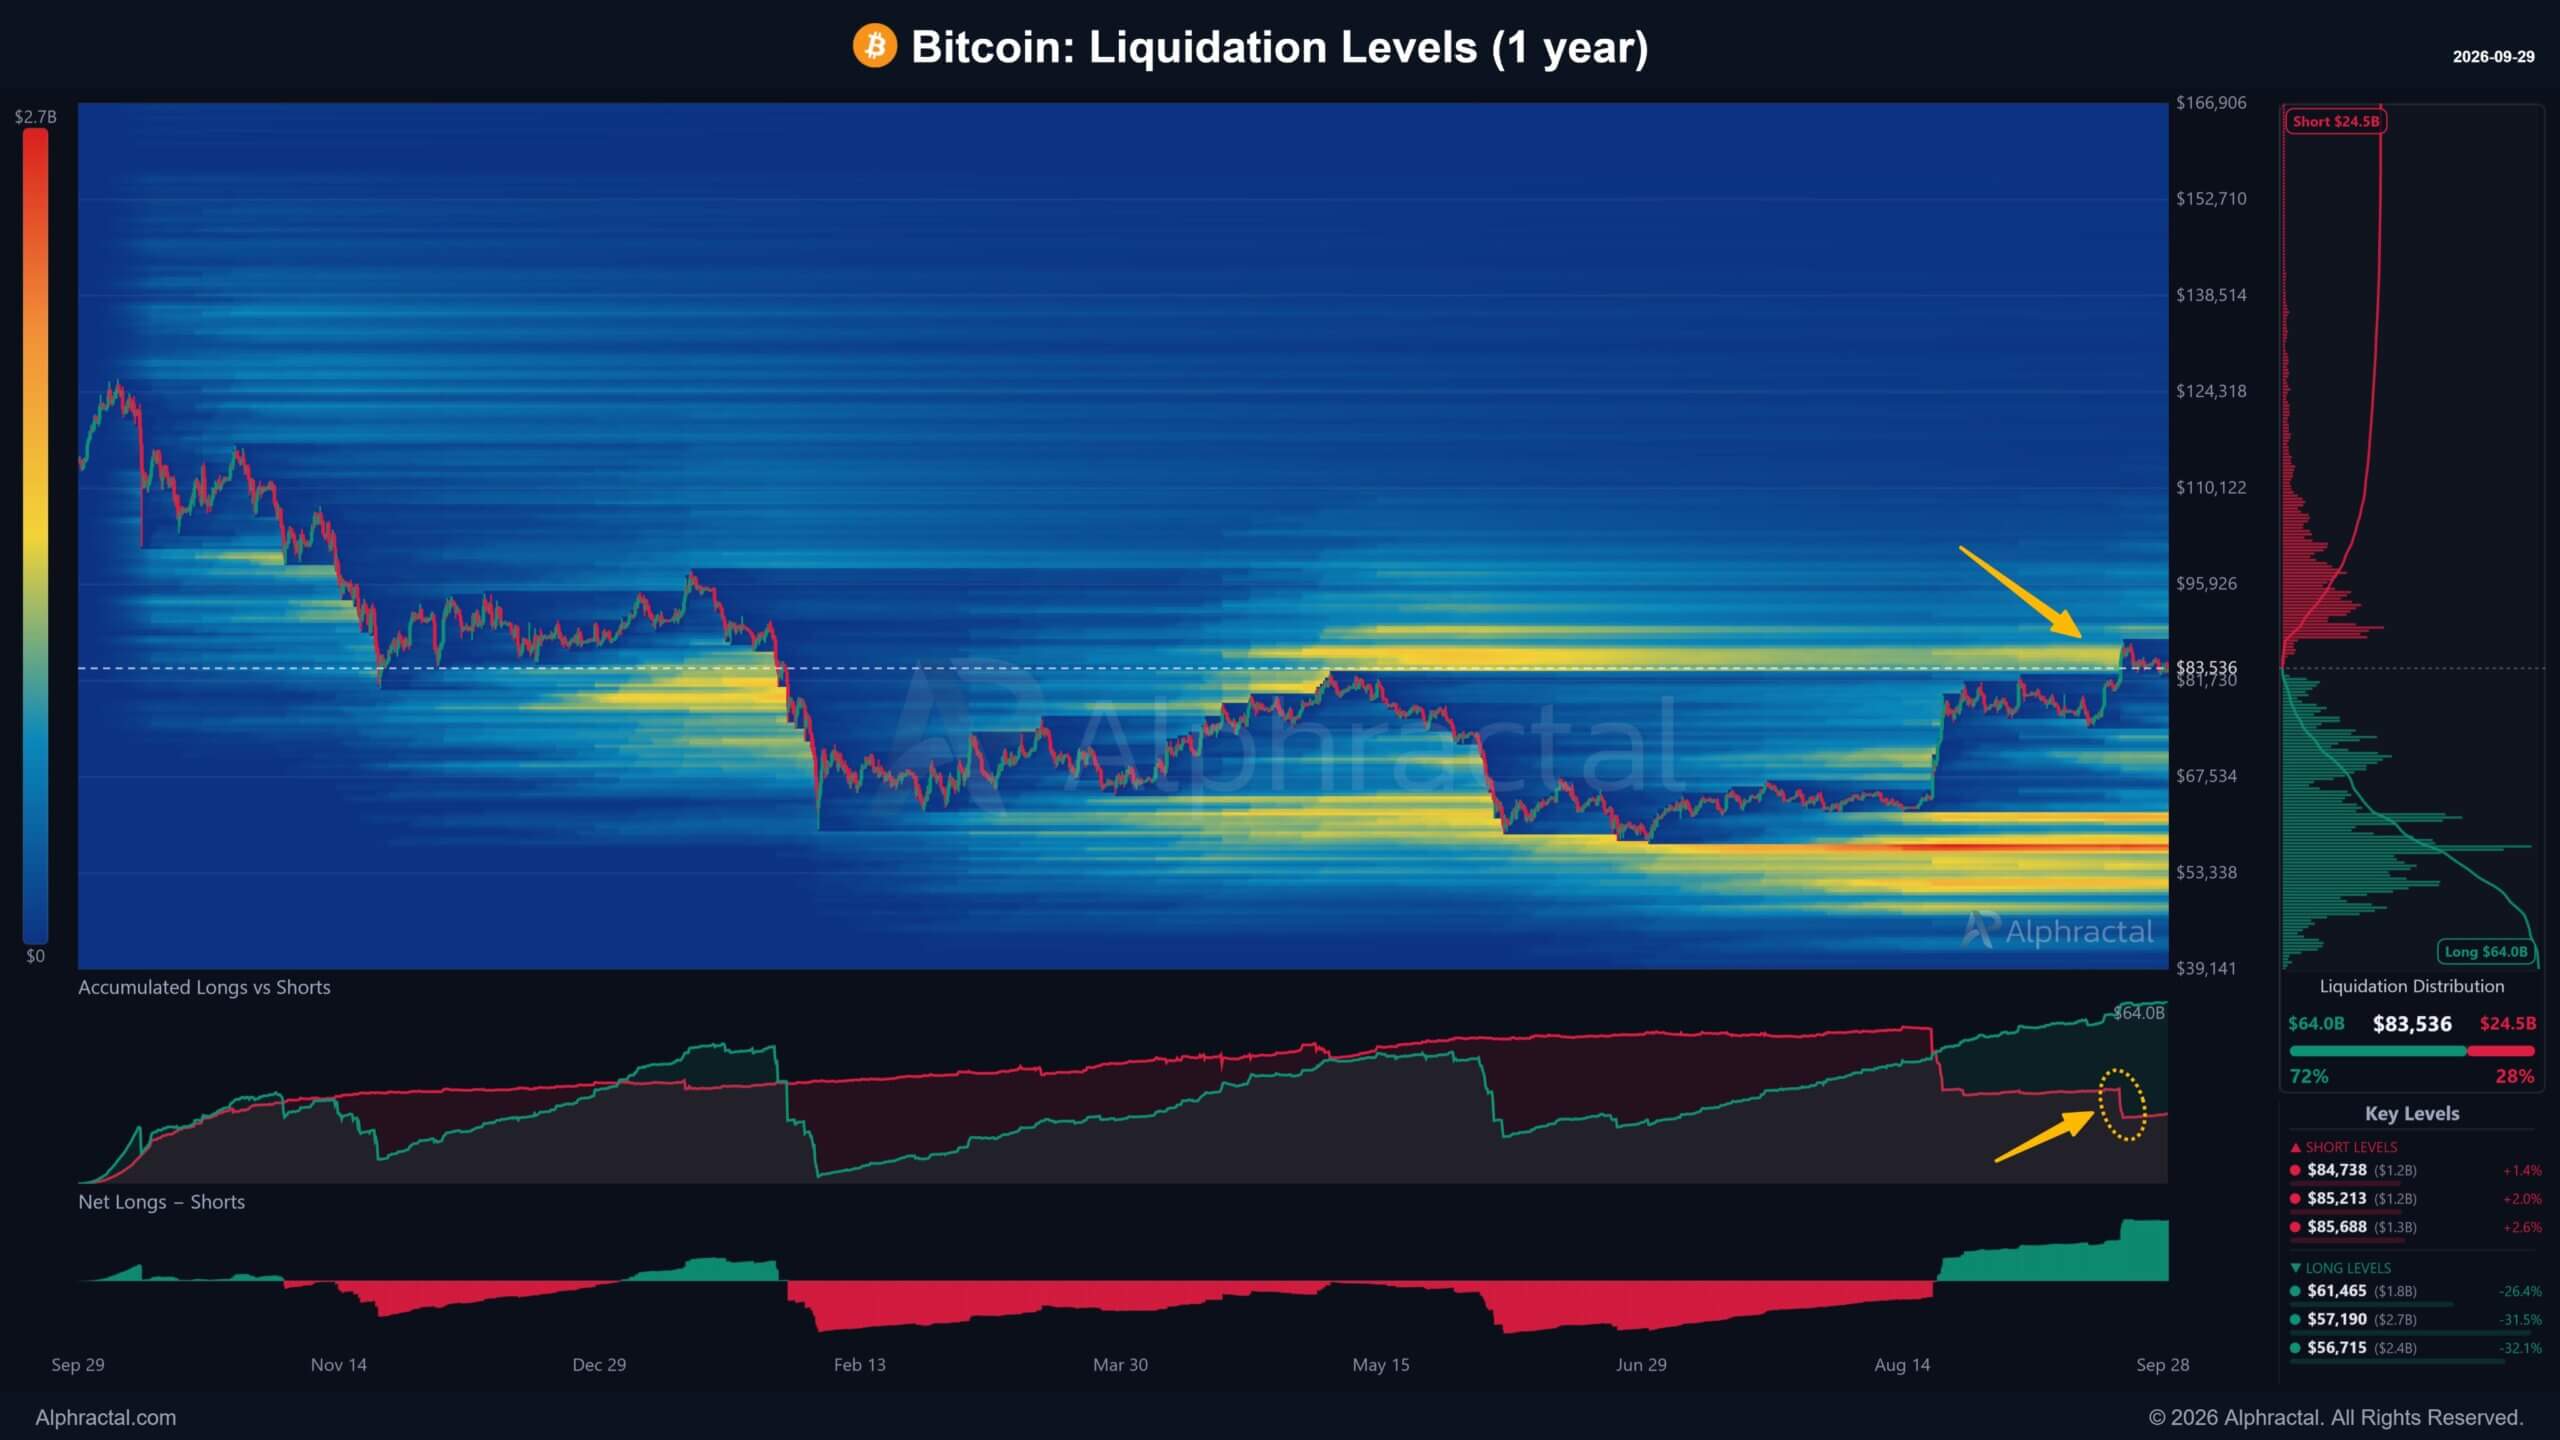
परिणामस्वरूप, यदि बिटकॉइन ऊपर की ओर एक और कदम उठाने का प्रयास करता है तो जबरन खरीदारी का दबाव प्रदान करने के लिए कम बड़ी शॉर्ट पोजीशन बची हैं। इसके विपरीत, एक नीचे की ओर सुधार क्लस्टर किए गए लॉन्ग पोजीशन को प्रभावित करना शुरू कर सकता है, जिससे लेवरेज्ड ट्रेडर्स को जबरन लिक्विडेशन बिक्री के स्रोत में बदला जा सकता है।
प्रमुख संस्थागत खिलाड़ियों और बड़े निवेशकों ने भी लंबे समय तक तेजी की प्रतिबद्धता का संकेत देने से परहेज किया है।
अल्फ्रेक्टल के मुख्य कार्यकारी अधिकारी जोआओ वेडसन ने बताया कि फर्म के व्हेल्स बनाम रिटेल डेल्टा ने हाल ही में छोटे खातों के सापेक्ष अधिक तेजी का रुख अपनाने वाली व्हेल का संकेत दिया था, हालांकि यह बदलाव खुद को बनाए रखने में विफल रहा। उन्होंने जोर देकर कहा कि बड़े संस्थाओं द्वारा विस्तारित ट्रेंड निरंतरता के लिए पोजीशनिंग करने का निर्णायक प्रमाण देने से पहले मीट्रिक को सकारात्मक होना चाहिए और वहां स्थिर होना चाहिए।
पोजीशनिंग में यह विकास यदि ऊपर की गति फीकी पड़ती रहती है तो बिटकॉइन की निचली तकनीकी सीमाओं को अधिक महत्व देता है।
365-दिन का मूविंग एवरेज $80,000 के करीब मंडराता है, जो उस प्रमुख सीमा का प्रतिनिधित्व करता है जिसे पहली बार क्रिप्टोक्वांट द्वारा नए बुल चरण की शुरुआत के रूप में नामित किए जाने पर पुनः प्राप्त किया गया था। आगे नीचे, 200-दिन का मूविंग एवरेज $71,000 के करीब रहता है, जबकि व्यापारियों के लिए एहसास की गई कीमत $67,000 के करीब है।
बदलती मांग गतिशीलता और संरचनात्मक पोजीशनिंग के खिलाफ ब्रेकआउट कितना लचीला है, इसके लिए $80,000 क्षेत्र की ओर एक पुलबैक पहली लिटमस टेस्ट के रूप में काम करेगा। उस स्तर का उल्लंघन करने से गहरे समर्थन क्षेत्रों के दरवाजे खुल जाएंगे और साथ ही शॉर्ट स्क्वीज़ द्वारा पीछे छोड़ी गई लॉन्ग पोजीशन के जबरन लिक्विडेशन के लिए अगले उत्प्रेरक में बदलने के खतरे को बढ़ा देगा।
अक्सर पूछे जाने वाले प्रश्न
- लगभग $87,400 के करीब बिटकॉइन की हालिया तेजी का क्या कारण था? एक दीर्घकालिक तकनीकी सीमा को फिर से हासिल करने के बाद बिटकॉइन आठ महीने के उच्चतम स्तर पर पहुंच गया, जिससे बिटकॉइन बुल स्कोर इंडेक्स 100 में से 90 पर पहुंच गया और बाजार की भावना जुलाई 2025 के बाद से अपने सबसे अधिक लालची स्तर पर पहुंच गई।
- विश्लेषक कमजोर होती मांग को लेकर क्यों चिंतित हैं? CryptoQuant का अनुमान है कि 30 दिनों में स्पष्ट हाजिर (स्पॉट) मांग में लगभग 170,000 BTC की कमी आई है, और अमेरिकी ETF में होने वाले निवेश में एक ही सप्ताह में 97% की गिरावट देखी गई।
- शॉर्ट से लॉन्ग जोखिम में बदलाव का व्यापारियों के लिए क्या अर्थ है? पिछली मूल्य वृद्धि शॉर्ट लिक्विडेशन से प्रेरित थी, जिसके कारण मंदी के रुख वाले (बेयरिश) व्यापारियों को अपनी पोजीशन वापस खरीदनी पड़ीं। अब, लाइक्विडेट न होने वाले पोजीशन क्लस्टर लॉन्ग साइड पर केंद्रित हैं, जिसका अर्थ है कि कीमत में गिरावट से लेवरेज्ड लॉन्ग व्यापारियों द्वारा जबरन बिकवाली शुरू हो सकती है।
- ध्यान देने योग्य महत्वपूर्ण गिरावट वाले समर्थन स्तर (सपोर्ट लेवल) क्या हैं? प्रमुख स्तरों में $80,000 के करीब 365-दिवसीय मूविंग एवरेज, $71,000 के करीब 200-दिवसीय मूविंग एवरेज और $67,000 के आसपास व्यापारियों की वास्तविक कीमत शामिल है।